El Niño 2026: food prices, Peru mud and Indonesia fire
The strengthening Pacific pattern can move rice, sugar, wheat and palm oil at once. Peru braces for mudslides. Indonesia maps peat fires. Nepal's August flood was a glacial collapse, not El Niño rain.
Approximate peak Oceanic Niño Index in degrees Celsius for major events. 2026 uses the July monthly Niño 3.4 value as the event was still strengthening.
+2.6°C
2015-16 peak
Peak anomaly. Figures shown for this story. Historic peaks follow NOAA ONI-style seasonal values. July 2026 monthly Niño 3.4 was about +2.0 C and later weekly readings ran higher as the event intensified.
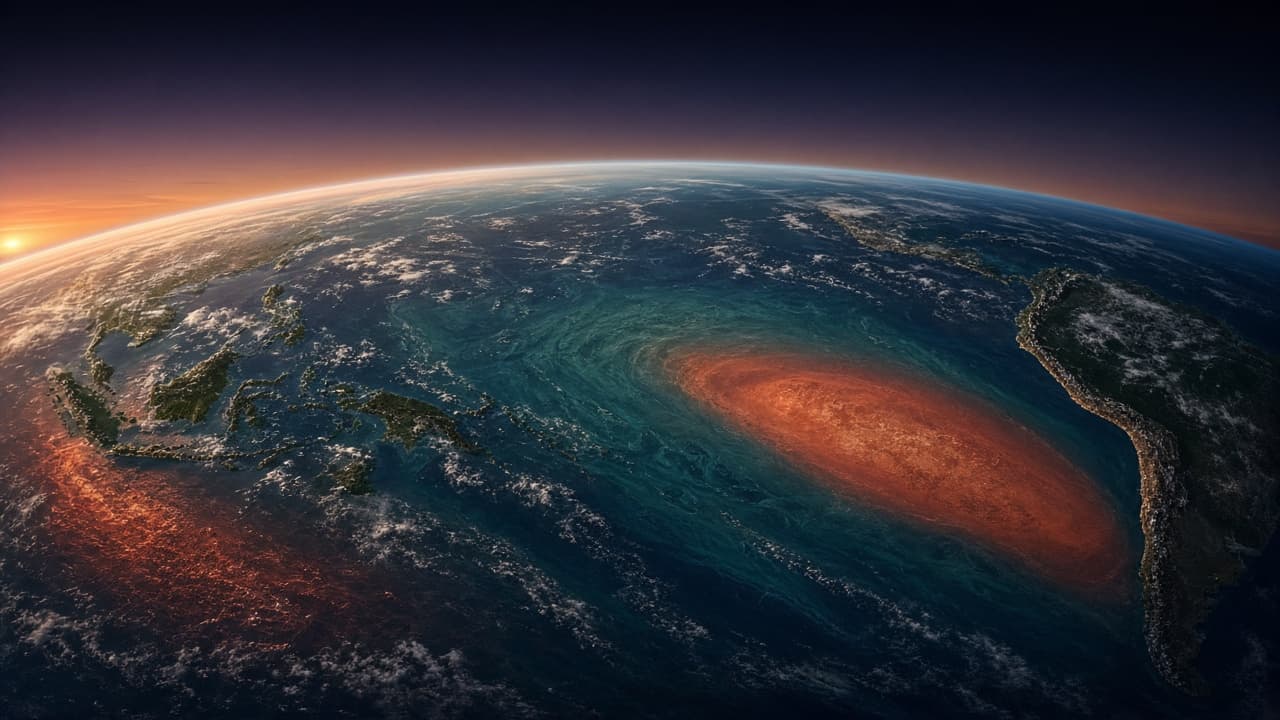
The 2026 El Niño is already a wallet story. One Pacific pattern can lift rice, sugar, wheat and palm oil together, because the wet countries and the dry countries sit on the same see-saw. Then it is a two-face disaster story: Peru and Ecuador brace for mud, while Indonesia maps peat fires. Then it is a myth story. Nepal's August flood on the Bhotekoshi was a glacial ice-and-rock collapse, not Pacific rain on Kathmandu. El Niño itself is not a storm and not a season. It is a climate pattern in the tropical Pacific: the ocean surface in the central and eastern equatorial Pacific runs unusually warm for months, the usual east-to-west trade winds slacken and rain belts jump. Scientists group it with the opposite cold phase, La Niña, under the name ENSO (El Niño-Southern Oscillation). A common yardstick is the Niño 3.4 region in the central Pacific. When that patch stays at least about 0.5 C above average, with matching winds and clouds, agencies call El Niño.
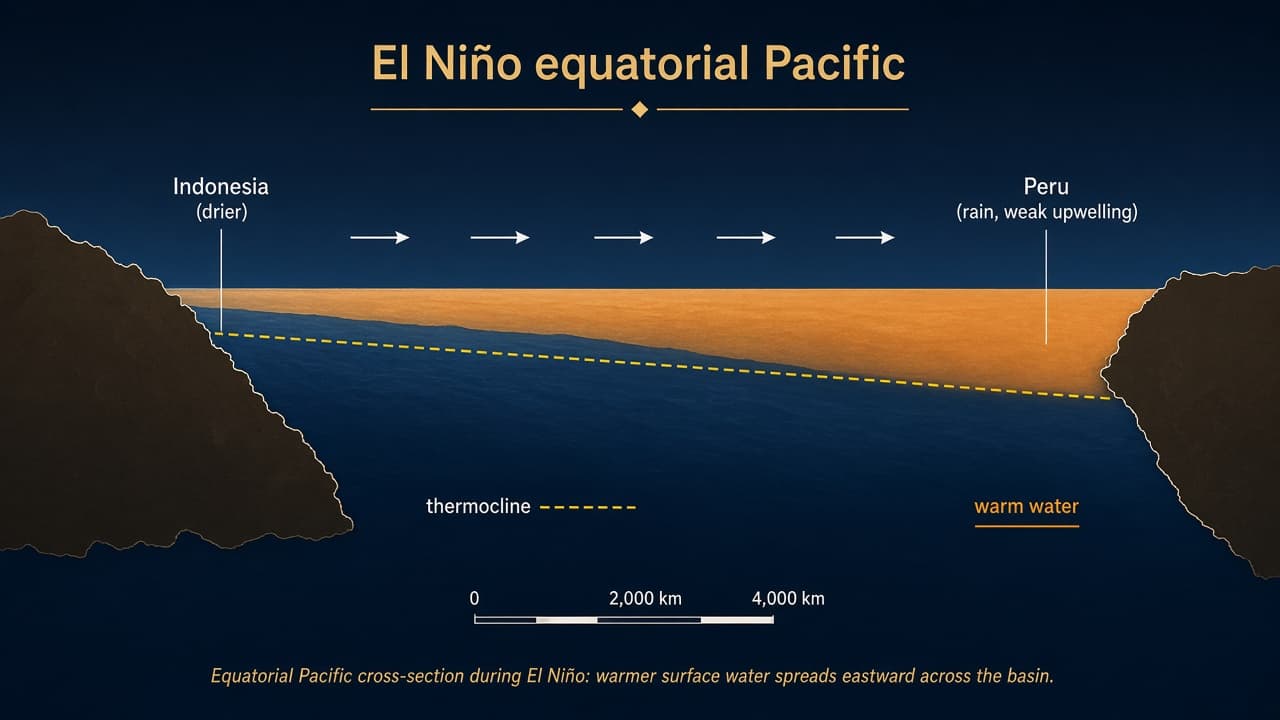
The name is Peruvian. Fishers noticed a warm current around Christmas and called it El Niño, the boy, after the Christ child. The physics is a see-saw of water and air. In a typical year, trade winds push warm surface water west toward Indonesia and Australia. Cold, nutrient-rich water wells up along Peru and Ecuador. That upwelling feeds anchoveta and a huge fishery. In El Niño the winds weaken. Warm water sloshes east. The thermocline (the boundary between warm surface water and cold deep water) deepens in the east, so upwelling brings less food to the surface. Thunderstorms follow the heat. Indonesia dries. The eastern Pacific rains.
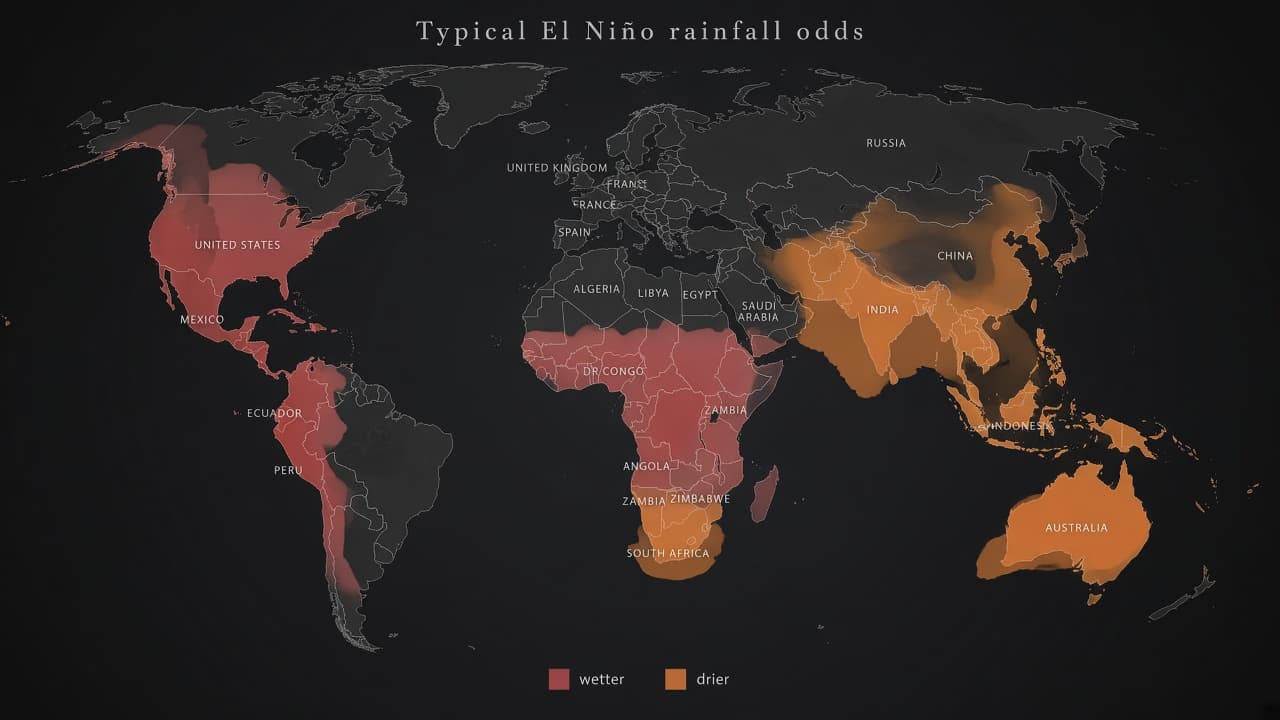
Impacts are regional, not uniform. The hardest-hit countries sit on the pattern's hinges. Peru and Ecuador take coastal floods, landslides and a crash in cold-water fish. Indonesia, Papua New Guinea and parts of the Philippines take drought, peat fires and haze. Australia's east and interior tilt dry, with fire weather. India often sees a weaker southwest monsoon and stress on kharif crops. Southern Africa (Zimbabwe, Zambia, Malawi, South Africa's maize belt) tilts toward drought and maize failure. The Horn and parts of East Africa can flood. Central America and northeast Brazil often dry. California, the U.S. Gulf Coast and the Southeast tilt wetter in northern winter, with more atmospheric rivers and fewer Atlantic hurricanes on average. Hawaii and some western Pacific islands can go dry. None of this is a guarantee. It is a shift in odds.
Past events show the body count and the bill. The 1982-83 and 1997-98 El Niños are the textbook catastrophes. In Peru, OCHA counted on the order of a hundred dead and tens of thousands affected by floods and landslides in 1997-98, with roads, rail and the Machu Picchu hydropower plant wrecked by mud. Ecuador's coast took similar hits. On the other side of the ocean, Indonesia's 1997-98 drought helped fires consume more than 9.7 million hectares of forest and peat. Rice failed at scale. Indonesia imported over five million tonnes of rice. Haze shut airports across Malaysia and Singapore. Papua New Guinea's highlands faced famine and malaria as people moved downhill.
2015-16 was another very strong event. Southern Africa had its worst drought in more than three decades. UN assessments put tens of millions in East and southern Africa at risk of food insecurity. Indonesia burned about 2.6 million hectares; losses were estimated around 16 billion dollars, near 2 percent of GDP. Floods displaced more than 150,000 people in Uruguay, Paraguay and Argentina. 2023-24 was strong but generally less lethal in Indonesia than 2015, with about 1.16 million hectares burned, still a serious fire year.
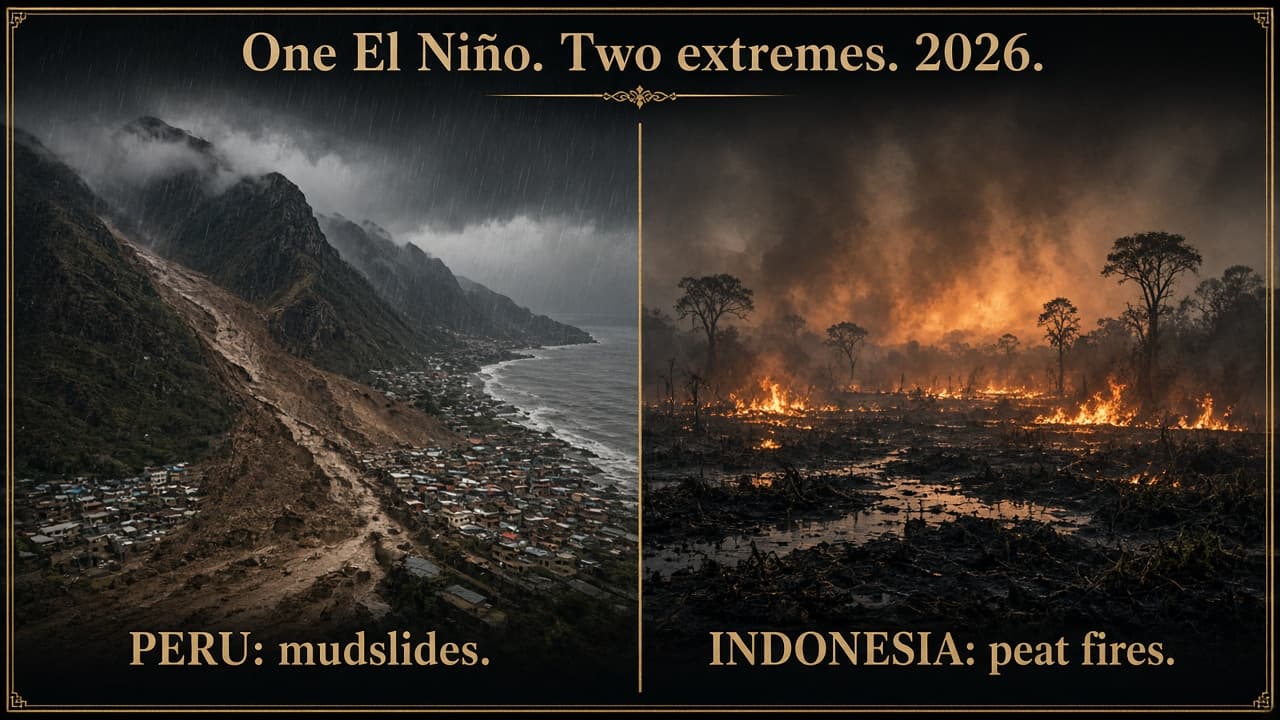
Dangers stack. Floods and debris flows kill quickly in the Andes and East African highlands. Drought kills slowly through crop failure, livestock deaths and water cuts. Peat fires load the air with particles that send people to hospital. Warmer coastal water off Peru and Ecuador starves fisheries and can feed algal blooms. Standing water after floods raises cholera and malaria. In cities, wet winters overload drains. In farm belts, a failed monsoon raises staple prices worldwide because El Niño is large enough to move rice, wheat, sugar and palm oil at the same time.
The 2026 event is the live one. NOAA's Climate Prediction Center, in its mid-August 2026 diagnostic, said El Niño was strengthening, with sea-surface anomalies above 3 C in parts of the eastern equatorial Pacific and a greater than 90 percent chance of a very strong event in northern-hemisphere fall and winter 2026-27. For October-December 2026 it put roughly a 75 percent chance on a historic seasonal reading that would exceed previous events in the record back to 1950. Columbia University's IRI, using models through mid-August, showed Niño 3.4 near +2.0 C in July and weekly values near +2.7 C, with almost all models keeping a very strong event into winter and El Niño likely into early 2027 before the usual spring fade.
What that forecast means on the ground is a raised alert, not a script. Indonesia is watching fire hotspots and rice. Peru is watching northern flood basins and the anchovy fleet. India is watching monsoon residuals and reservoirs. Southern Africa is watching the coming maize season. California and the U.S. Southeast should plan for wet storms and saturated soils even while the Atlantic hurricane count may run below average. Background climate change loads extra heat into the same ocean, so a strong El Niño now rides on warmer baseline temperatures than 1997. Agencies still cannot say a specific town will flood on a specific date. They can say the next six to nine months look like a year when the usual El Niño map should be taken seriously.
Do not pin Nepal's 26 August 2026 disaster on the Bhotekoshi in Rasuwa to El Niño rain. ReliefWeb and Nepali reporting say a surge came down from the Tibet border. Scientists using satellite images and seismic records pointed to an ice-and-rock avalanche that blocked a tributary, built a short-lived dam and then failed. Meteorologists ruled out heavy local rain in Rasuwa as the trigger. The U.S. Geological Survey recast an early quake reading as a glacial collapse signal. A similar flood on the same corridor in July 2025 was tied to a supraglacial lake draining. That is mountain ice and rock under a warming Himalaya, not Pacific trade winds dumping a monsoon on Kathmandu. The distinction matters because the Himalaya needs glacier and dam-break warning, while El Niño needs peat, seed and flood-basin work on a different map.
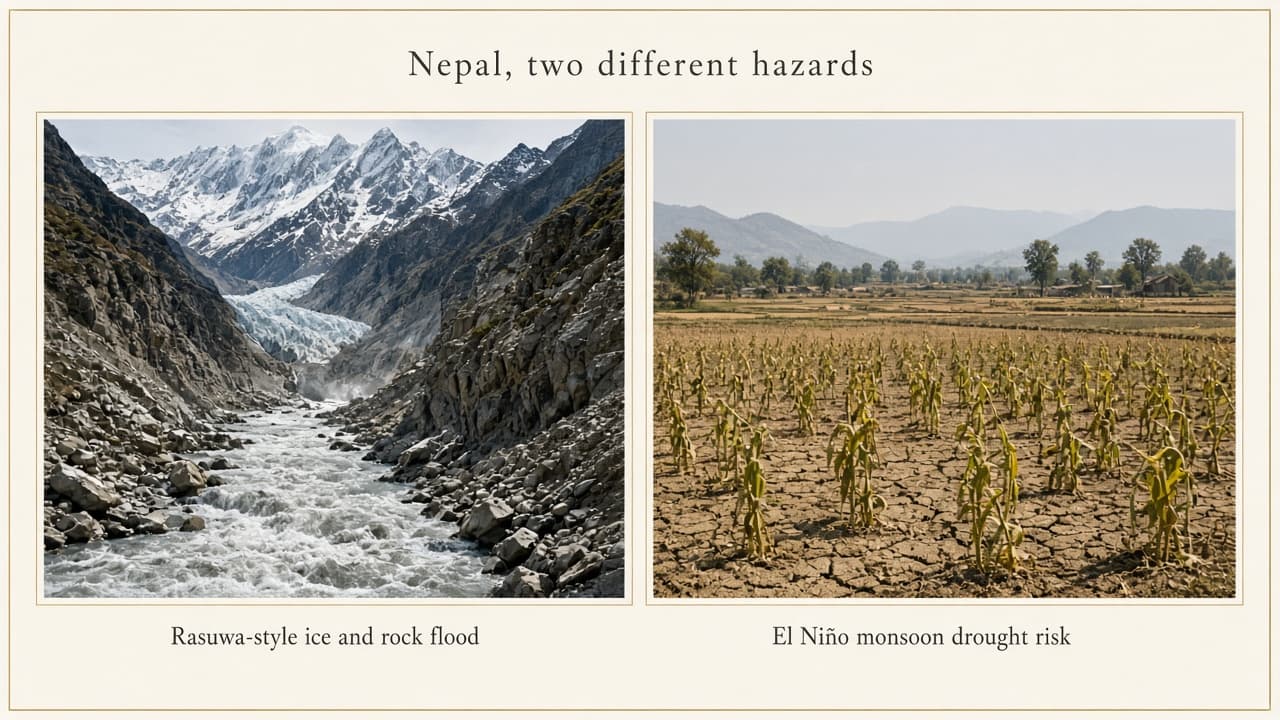
El Niño still matters for Nepal and neighbours. ICIMOD's 2026 Hindu Kush Himalaya monsoon outlook, issued as El Niño developed, pointed to below-normal rain and above-normal heat across Bhutan, India, Nepal and Pakistan, plus a nasty mix: long dry spells, then short violent bursts that can still start landslides, flash floods and glacial-lake failures. Kathmandu Post climate coverage noted that in most El Niño years Nepal's monsoon runs light, but not in every year, and that 2025 already mixed a below-normal seasonal total with deadly late downpours. So: do not blame Rasuwa on El Niño. Do treat El Niño as extra drought and extra wild-card rain for the hills.
Country examples, in plain terms. Peru and Ecuador get warm coastal water, a failed anchovy catch, then torrential rain on normally dry desert cities. Houses, roads and clinics wash out. Fish plants idle. Ecuador's 1997-98 coast was a case study in that double hit.
Kenya and Somalia in 1997-98 took El Niño rains that flooded the Horn, wrecked crops already in the ground and then fed cholera and malaria. Southern Africa is the drought side: Zimbabwe, Zambia, Malawi and South Africa's maize belt dry out in the November-March rains. Livestock die. Grain imports spike.
Indonesia and Papua New Guinea take drought, peat fires and haze that closes airports in Singapore and Malaysia, plus rice imports and highland hunger. Australia tilts toward fire weather and failed winter crops in the east and south, though not every El Niño produces a national drought. India usually risks a weaker southwest monsoon, with knock-on effects for reservoirs and food inflation. FAO has run drought anticipatory-action protocols in the Philippines, Timor-Leste, Cambodia and Vietnam.
Central America's Dry Corridor (Guatemala, Honduras, El Salvador, Nicaragua) misses rains, loses beans and maize and feels more migration pressure. Northeast Brazil often dries. Uruguay, Paraguay and Argentina can flood instead: more than 150,000 people were displaced in 2016. California and the U.S. Gulf and Atlantic coasts tilt toward wetter winters and atmospheric rivers, with fewer Atlantic hurricanes on average. Hawaii can go dry.
Financial and economic impact is the bill after the weather. Indonesia's 2015 fire season was estimated near 16 billion dollars, about 2 percent of GDP that year. A failed southern African maize crop forces governments to import dollar grain and can lift bread prices far from the drought. Peru's fishmeal and fish-oil exports sag when anchoveta vanish. Insurers pay more for flood and crop claims in the wet countries. Shipping, tourism and hydropower take hits when rivers either empty or burst. FAO and WFP appeals for El Niño seasons run into the hundreds of millions of dollars for seeds, cash and water before harvests fail. Households feel it as lost wages, sold livestock and school dropouts, which is slower than a headline death toll and lasts longer.
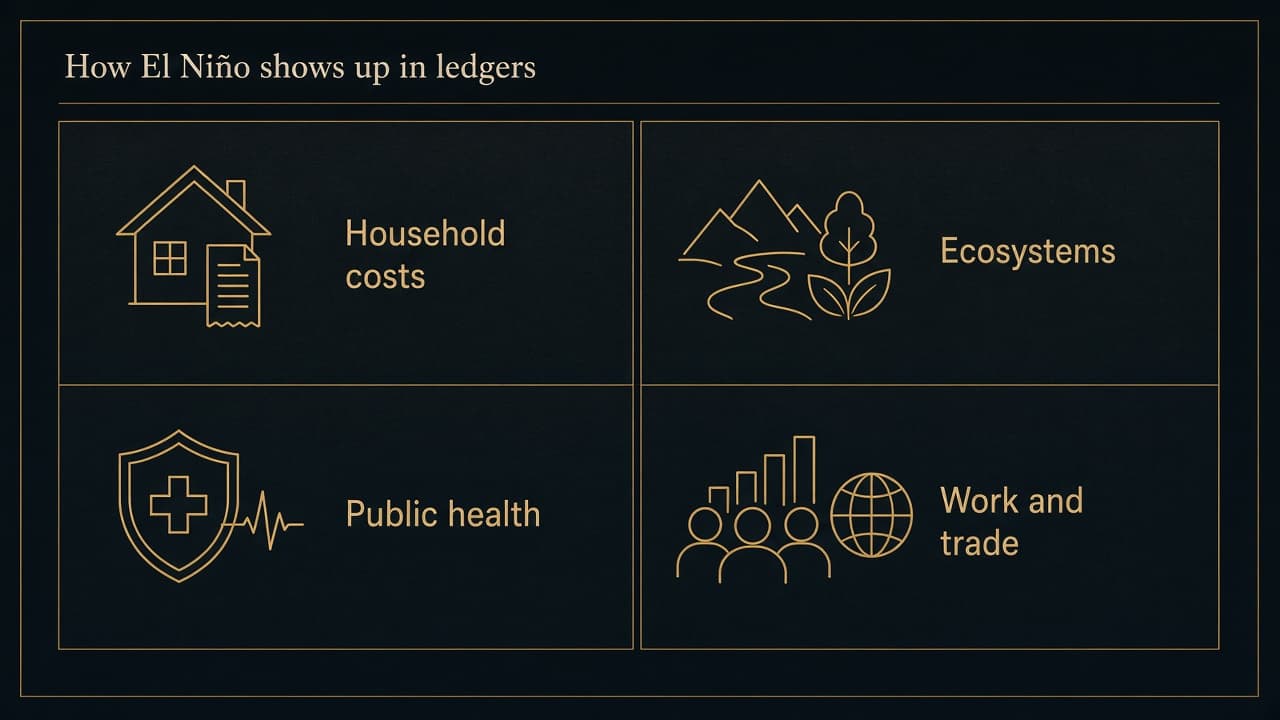
Environmental impact is the landscape changing underfoot. Drought dries peat so fires burn into the soil and keep smoking. Floods strip topsoil and dump sediment on coral and farms. Warm Pacific water bleaches reefs in some basins and starves Peru's upwelling ecosystem. Haze from Indonesia's fires is a transboundary air-quality emergency. In the Himalaya, El Niño is one of several climate pressures. The Rasuwa-style ice-and-rock floods sit more in the long warming of glaciers than in a single Pacific season, but a hotter, drier monsoon can still raise water stress and then dump rain on unstable slopes.
Social impact is who gets hurt. Smallholders, fishers, informal labourers and people already short of savings take the first blow. Women often walk farther for water in drought. After floods, overcrowded shelters spread disease. Papua New Guinea in 1997-98 showed a cruel twist: highlanders who fled drought into the lowlands caught malaria they had little immunity to. Cities import food and pass the cost to the poorest shoppers. Political stress follows when bread prices jump or a fishing town loses its season.
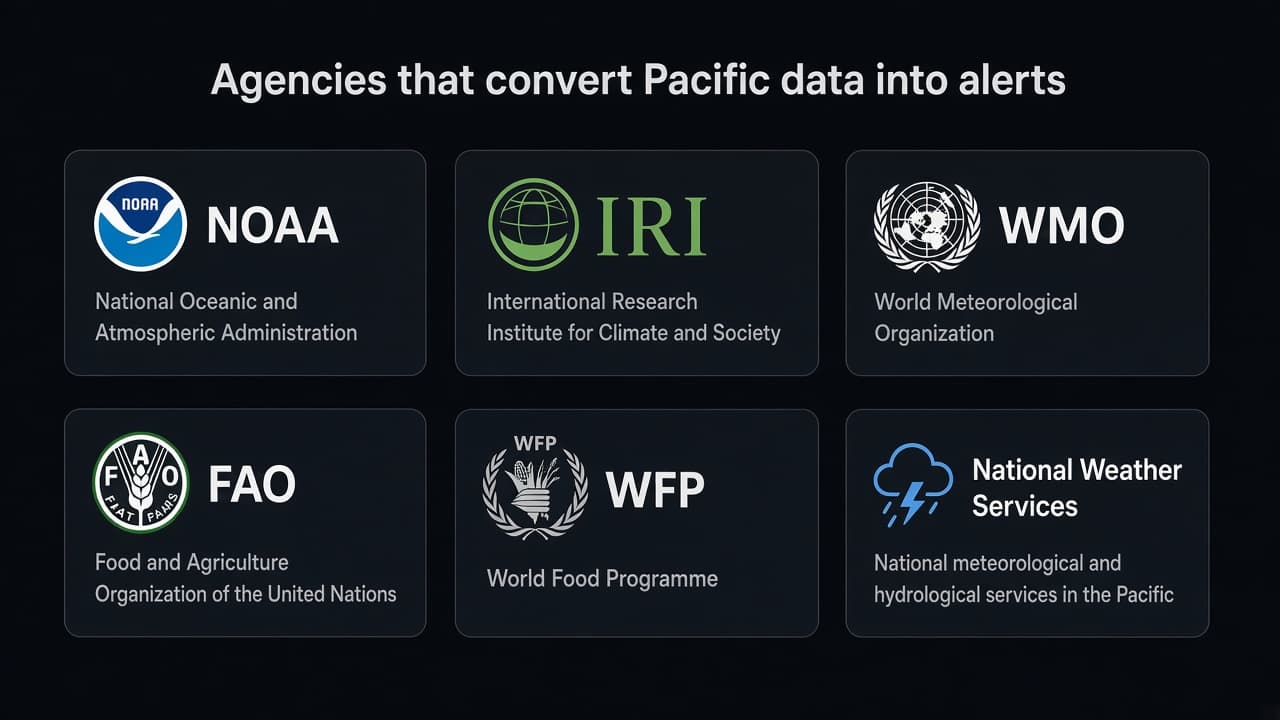
How to prepare is boring on purpose. Watch the official seasonal outlook, not a viral map. NOAA, the WMO and national services such as India's IMD or Peru's SENAMHI publish ENSO updates. FAO and WFP use those outlooks to trigger anticipatory action: drought-tolerant seed, livestock feed, cash before the failed harvest, not after. Flood countries clear drains, pre-position sandbags and practise evacuation on known alluvial fans. Fire countries enforce burning bans and staff peat-hotspot patrols. Households can store water, keep documents in a dry bag, know the nearest high ground and not plant a full maize crop on a forecast of a failed rainy season if officials say wait. Insurance and shock-responsive cash (as WFP has built with governments in parts of Latin America) beat passing the hat after the fact.
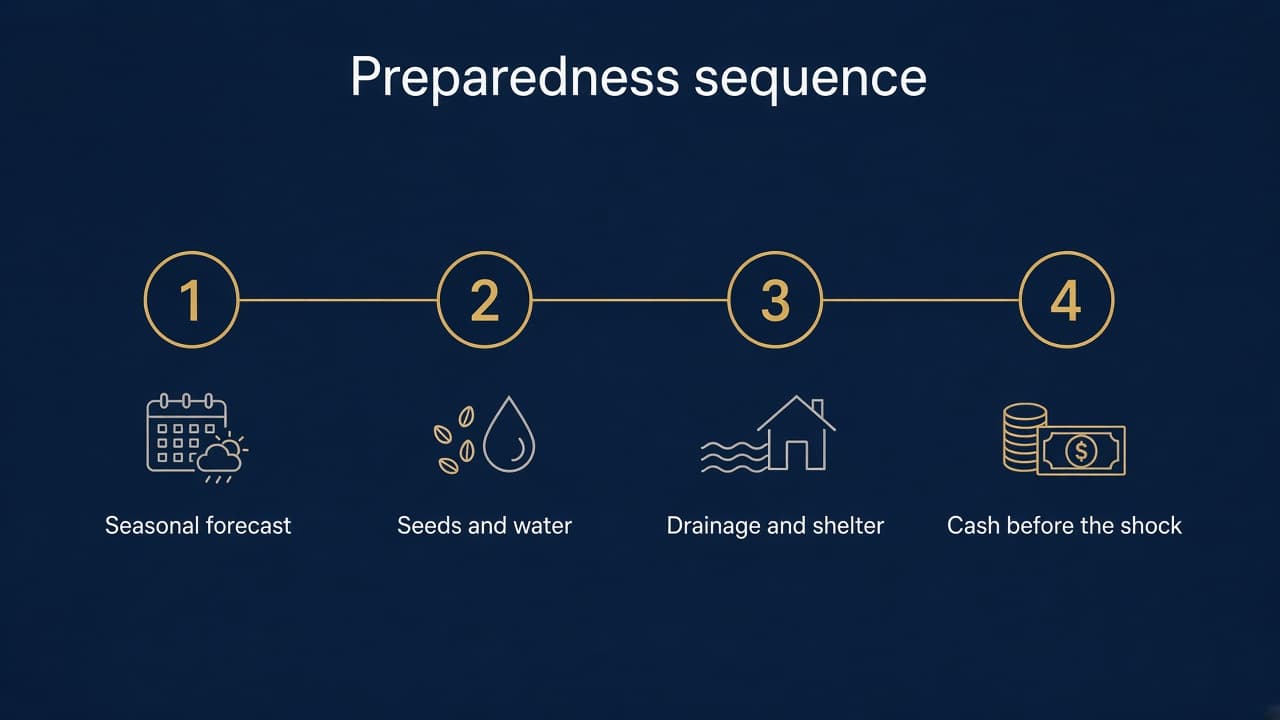
Minimizing future damage is not the same as stopping El Niño. The Pacific pattern is natural. What can shrink the death and the bill is: denser weather stations and glacier monitoring in mountains; peatland rewetting in Indonesia so the next drought does not light a 2015-scale fire; diversified staples so one maize failure does not empty the plate; building codes and no-build zones on debris fans in Peru and Nepal; social protection that pays out when a rainfall index drops. Climate change does not create El Niño, but it raises the baseline heat so each event starts warmer. Cutting greenhouse gases is the slow global lever. Early warning is the fast local one.
Nations and organizations already run that machine. NOAA and Japan's JMA and Australia's BoM feed the IRI plume of models. The WMO coordinates the global watch. FAO's 2023-24 anticipatory plan covered dozens of countries and put money into Madagascar, Malawi, Mozambique, Zimbabwe and Pacific islands before drought peaked. WFP, UNICEF and PAHO worked with OCHA on a CERF-backed framework for Central America's Dry Corridor. Indonesia issues drought emergency alerts at province level and has tried to avoid a repeat of 2015 with fire command posts. Peru's civil defence and SENAMHI run flood and drought protocols on opposite ends of the same country. Southern African climate outlook forums brief maize ministries every season. None of that reverses El Niño. It shortens the time between a Pacific temperature chart and a farmer changing seed.
Eagle Frame's takeaway: El Niño is Pacific heat that steals rain from Indonesia, India and southern Africa and dumps it on Peru, Ecuador and often the southern United States. Nepal's August 2026 Bhotekoshi flood was a Himalayan ice-and-rock cascade, not that rain map, though El Niño can still make Nepal's monsoon drier and more violent in bursts. The disasters of 1982-83, 1997-98 and 2015-16 were the classic map at full volume. NOAA and IRI now point to a very strong 2026-27 event. Prepare with forecasts, seed, water, drains and cash. Treat every local disaster as its own inquest, not a sticker that says El Niño.